Date of Issue:Apr 17, 2026Expiration:Apr 17, 2031Last updated:Apr 17, 2026ENVIRONMENTALPRODUCT DECLARATIONIN ACCORDANCE WITH ISO 14025 AND EN 15804:2012+A2:2019/AC:2021Category 6A Patch CordsSmartEPD-2026-128-0833-01
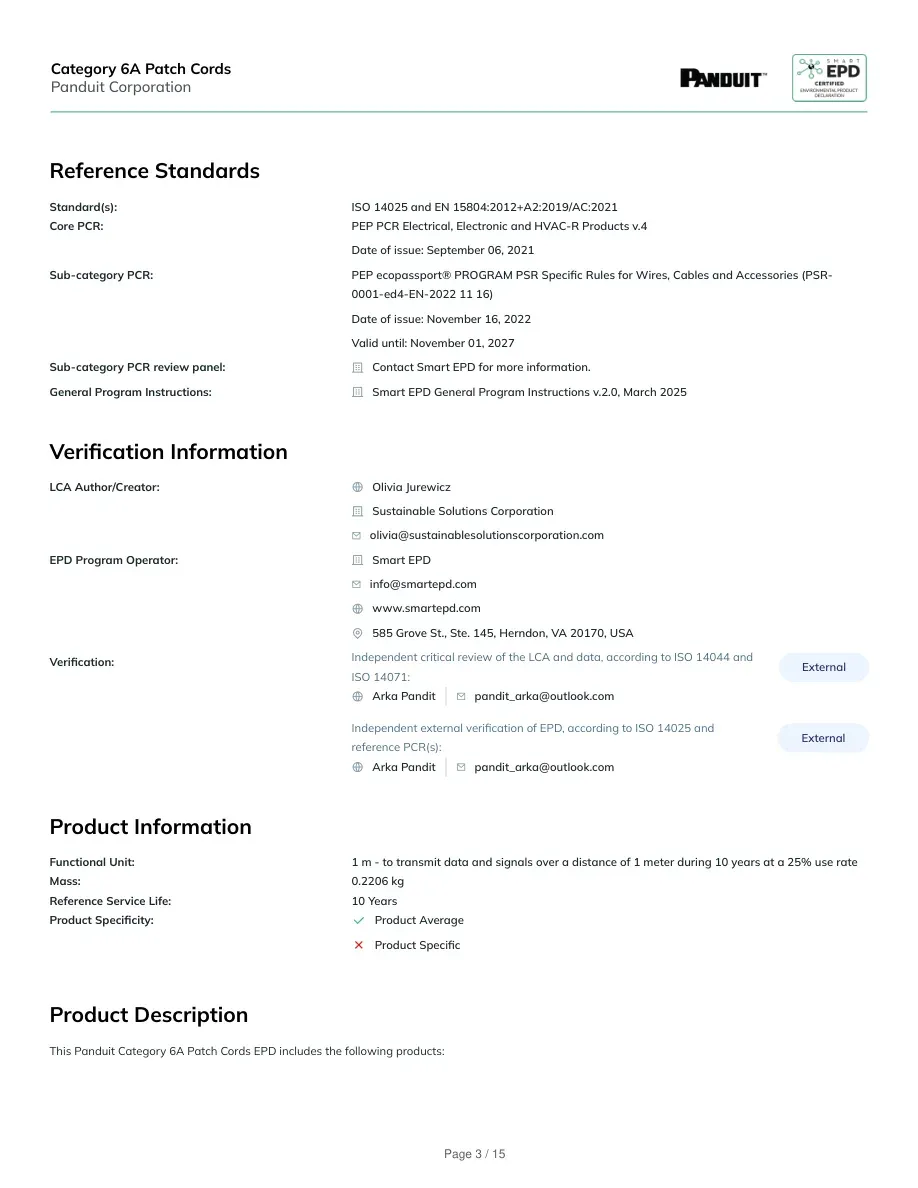
General InformationPanduit Corporation18900 Panduit Drive, Tinley Park, IL 60487800-777-3300TechSupport@panduit.companduit.comProduct Name:Category 6A Patch CordsFunctional Unit:1 m - to transmit data and signals over a distance of 1 meter during 10 years at a 25% use rateDeclaration Number:SmartEPD-2026-128-0833-01Date of Issue:April 17, 2026Expiration:April 17, 2031Last updated:April 17, 2026EPD Scope:Cradle to graveA1 - A3, A4, A5, B1 - B7, C1 - C4, DMarket(s) of Applicability:GlobalGeneral Organization InformationAt Panduit, we understand that what we deliver matters: high-quality infrastructure and connectivity solutions. But it’s how we deliver them that defineswho we are. We remain deeply aware of our environmental responsibilities, the importance of an inclusive workplace, and the value of transparent, ethicalgovernance. These principles guide every decision we make and shape how we serve our customers, our people, and our partners.As we’ve grown, so has our commitment—to not only deliver dependable, scalable network connectivity and powerful infrastructure, but also to embedsustainability into everything we do. By integrating environmental, social, and governance principles into our operations, we’re creating smarter solutionsthat reduce packaging waste, move products more efficiently, and support a more responsible customer journey. Today’s successes are the springboard forwhat comes next - anticipating tomorrow’s challenges so we can build a future that is more connected, resilient, and sustainable." Further information can be found at:https://www.panduit.com/en/about/about-panduit/environmental-social-and-governance.htmlLimitations, Liability and OwnershipThis declaration is an environmental product declaration (EPD) in accordance with ISO 14025 and EN 15804+A2. EPDs rely on Life Cycle Assessment (LCA)to provide information on a number of environmental impacts of products over their life cycle. Exclusions: EPDs do not indicate that any environmental orsocial performance benchmarks are met, and there may be impacts that they do not encompass. LCAs do not typically address the site-specificenvironmental impacts of raw material extraction, nor are they meant to assess human health toxicity. EPDs can complement but cannot replace tools andcertifications that are designed to address these impacts and/or set performance thresholds – e.g. Type 1 certifications, health assessments anddeclarations, environmental impact assessments, etc.Accuracy of Results: EPDs regularly rely on estimations of impacts, and the level of accuracy in estimation of effect differs for any particular product line andreported impact. Comparability: EPDs are not comparative assertions and are either not comparable or have limited comparability when they cover differentlife cycle stages, are based on different product category rules or are missing relevant environmental impacts. EPDs from different programs may not becomparable.Category 6A Patch CordsPanduit CorporationPage 2 / 15
Reference StandardsStandard(s):ISO 14025 and EN 15804:2012+A2:2019/AC:2021Core PCR:PEP PCR Electrical, Electronic and HVAC-R Products v.4Date of issue: September 06, 2021Sub-category PCR:PEP ecopassport® PROGRAM PSR Specific Rules for Wires, Cables and Accessories (PSR-0001-ed4-EN-2022 11 16)Date of issue: November 16, 2022Valid until: November 01, 2027Sub-category PCR review panel:Contact Smart EPD for more information.General Program Instructions:Smart EPD General Program Instructions v.2.0, March 2025Verification InformationLCA Author/Creator:Olivia JurewiczSustainable Solutions Corporationolivia@sustainablesolutionscorporation.comEPD Program Operator:Smart EPDinfo@smartepd.comwww.smartepd.com585 Grove St., Ste. 145, Herndon, VA 20170, USAVerification:Independent critical review of the LCA and data, according to ISO 14044 andISO 14071:ExternalArka Panditpandit_arka@outlook.comIndependent external verification of EPD, according to ISO 14025 andreference PCR(s):ExternalArka Panditpandit_arka@outlook.comProduct InformationFunctional Unit:1 m - to transmit data and signals over a distance of 1 meter during 10 years at a 25% use rateMass:0.2206 kgReference Service Life:10 YearsProduct Specificity:Product AverageProduct SpecificProduct DescriptionThis Panduit Category 6A Patch Cords EPD includes the following products:Category 6A Patch CordsPanduit CorporationPage 3 / 15
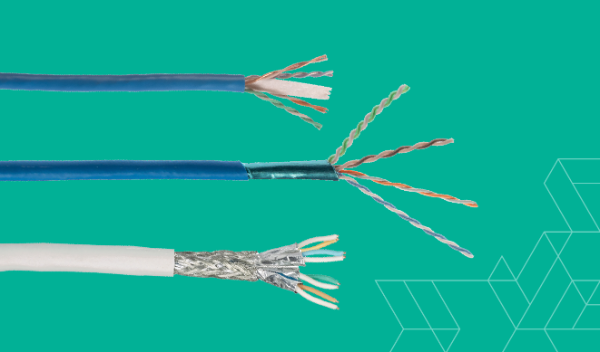
UTP6AX** Category 6A UTP Patch CordsUTP28X** Category 6A 28AWG UTP Patch CordsSTP6X** Category 6A Shielded Patch CordsSTP28X** Category 6A 28AWG Shielded Patch CordsNK6APC** NetKey Category 6A UTP Patch CordsProduct SpecificationsProduct SKU(s):This EPD presents the impacts of UTP6AX** as the baseline product, but this EPD is representativeof the products listed in the Product Description section.Product Classification Codes:UNSPSC - 43223303Table 1. Material CompositionMaterial/Component CategoryOrigin% MassCopper WireNone92.94PolyesterNone7.06Packaging MaterialOriginkg MassCardboardNone0.0530PaperNone0.0078Biogenic Carbon Contentkg C per mBiogenic carbon content in product0NoneBiogenic carbon content in accompanyingpackaging0.008289Hazardous MaterialsNo regulated hazardous or dangerous substances are included in this product.EPD Data SpecificityPrimary Data Year:2024Manufacturing Specificity:Industry AverageManufacturer AverageFacility SpecificAveraging:Allocation for the products within this EPD was conducted based on weighted production by mass.Category 6A Patch CordsPanduit CorporationPage 4 / 15
Table 2. System BoundaryProductionA1Raw material supplyA2TransportA3ManufacturingConstructionA4Transport to siteA5Assembly / InstallUseB1UseB2MaintenanceB3RepairB4ReplacementB5RefurbishmentB6Operational Energy UseB7Operational Water UseEnd of LifeC1DeconstructionC2TransportC3Waste ProcessingC4DisposalBenefits & Loads BeyondSystem BoundaryDRecycling, Reuse Recovery PotentialNote:ND = Module not declaredPlantsNorth AmericaNorth AmericaAsiaAsiaEuropeEuropeCategory 6A Patch CordsPanduit CorporationPage 5 / 15
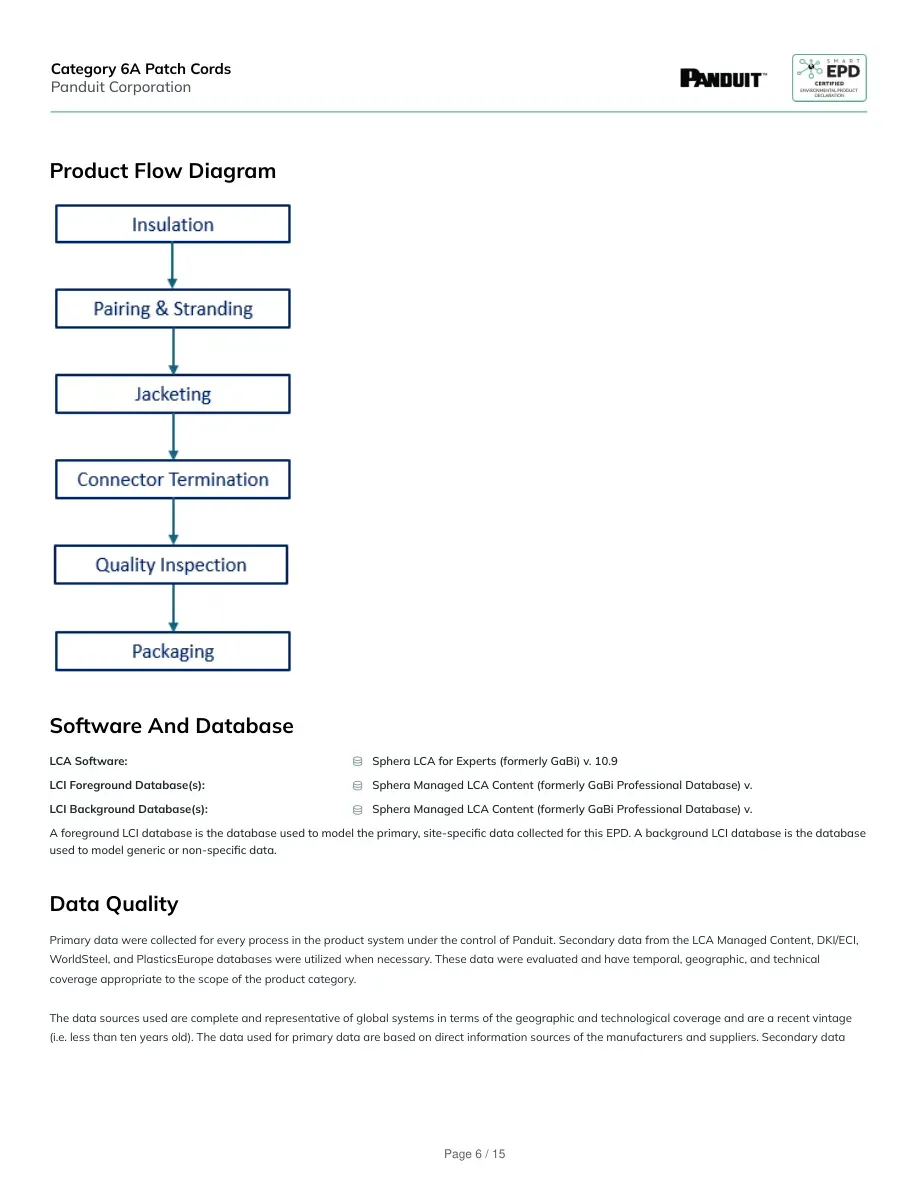
Product Flow DiagramSoftware And DatabaseLCA Software:Sphera LCA for Experts (formerly GaBi) v. 10.9LCI Foreground Database(s):Sphera Managed LCA Content (formerly GaBi Professional Database) v.LCI Background Database(s):Sphera Managed LCA Content (formerly GaBi Professional Database) v.A foreground LCI database is the database used to model the primary, site-specific data collected for this EPD. A background LCI database is the databaseused to model generic or non-specific data.Data QualityPrimary data were collected for every process in the product system under the control of Panduit. Secondary data from the LCA Managed Content, DKI/ECI,WorldSteel, and PlasticsEurope databases were utilized when necessary. These data were evaluated and have temporal, geographic, and technicalcoverage appropriate to the scope of the product category.The data sources used are complete and representative of global systems in terms of the geographic and technological coverage and are a recent vintage(i.e. less than ten years old). The data used for primary data are based on direct information sources of the manufacturers and suppliers. Secondary dataCategory 6A Patch CordsPanduit CorporationPage 6 / 15
sets were used for raw materials extraction and processing, end of life, transportation, and energy production flows. Wherever secondary data is used, thestudy adopts critically reviewed data for consistency, precision, and reproducibility to limit uncertainty.Life Cycle Module DescriptionThe primary manufacturing processes occur in multiple locations across North America, Europe, and Asia. All manufacturing sites that produce the cablesthat are included in this EPD product grouping are included in this scope.Copper wire goes through two drawing processes with an immediate subsequent annealing process. The wire continues down the line to an extruder wherethe insulation material is applied to the wire. Cooling and drying of the insulated wire then occurs. Insulated wires are then twinned together around eachother. Twinned wire pairs, along with other cable components such as separator tape and/or shielding material, are then bunched together. Subsequently,the bunched wire has a jacket extruded around the bunched cable. After the jacket is applied, the cable is cooled and packaged. Various packaging optionsexist, but most products are shipped in spools and/or boxes.LCA DiscussionAllocation ProcedureThe LCI data was collected from the Panduit manufacturing facilities for the 2024 calendar year. Allocation was determined on a per meter basis for primarydata. For secondary data, cut-off methodology was used.Cut-off ProcedureProcesses whose total contribution to the final result, with respect to their mass and in relation to all considered impact categories, is less than 1% can beneglected.The sum of the neglected processes may not exceed 5% by mass of the considered impact categories. For that a documented assumption is admissible.For Hazardous Substances the following requirements apply:• The Life Cycle Inventory (LCI) of hazardous substances will be included, if the inventory is available.• If the LCI for a hazardous substance is not available, the substance will appear as an input in the LCI of the product, if its mass represents more than 0.1%of theproduct composition.• If the LCI of a hazardous substance is approximated by modeling another substance, documentation will be provided.This EPD is in compliance with the cut-off criteria. No processes were neglected or excluded. Capital items for the production processes (machine, buildings,etc.) werenot taken into consideration.Renewable ElectricityEnergy Attribute Certificates (EACs) such asRenewable Energy Certificates (RECs) or PowerPurchase Agreements (PPAs) are included in thebaseline reported results:NoCategory 6A Patch CordsPanduit CorporationPage 7 / 15
ScenariosTransport to the building/construction site (A4)A4 ModuleFuel Type:DieselLiters of Fuel:38 l/100kmInstallation in to the building/construction site (A5)A5 ModuleInstallation Scrap Rate Assumed:5 %Product Lost per Declared/Functional Unit:1.10E-02 kgWaste Materials at the Construction Site BeforeWaste Processing:6.08E-02 kgMass of Packaging Waste Specified by Type:5.30E-02 cardboard, 7.81E-03 paper kgBiogenic Carbon Contained in Packaging (kg C):8.29E-03 kgAssumptions for scenario development:To install these products into a building, some scrap will be generated. Per the PSR, installationscrap rate is assumed to be 5%. Packaging waste is also generated. All waste is empiricallyassumed to be disposed of in a landfill and to be transported 100 km by truck.Use (B1)B1 ModuleMaintenance:The use phase of this study leverages the system boundary as described in Section 3.2 of the PSR, which details that Module B1 is not applicable and sothe module is equal to zero.Maintenance (B2)B2 ModuleFurther assumptions for scenario development:The use phase of this study leverages the system boundary as described in Section 3.2 of thePSR, which details that Module B2 is not applicable and so the module is equal to zero.Repair (B3)B3 ModuleFurther assumptions for scenario development:The use phase of this study leverages the system boundary as described in Section 3.2 of thePSR, which details that Module B3 is not applicable and so the module is equal to zero.Replacement (B4)B4 ModuleCategory 6A Patch CordsPanduit CorporationPage 8 / 15
Further assumptions for scenario development:The use phase of this study leverages the system boundary as described in Section 3.2 of thePSR, which details that Module B4 is not applicable and so the module is equal to zero.Refurbishment (B5)B5 ModuleFurther assumptions for scenario development:The use phase of this study leverages the system boundary as described in Section 3.2 of thePSR, which details that Module B5 is not applicable and so the module is equal to zero.Operational Energy Use (B6) & Operational Water Use (B7)B6 & B7 ModulesCharacteristic Performance:The study assumes the service life is 10 years with a 25% use rate, so that the used time is 2.5 years, in line with the PSR LAN: tertiary applicationsscenario. Energy consumed during use correlates to power losses due to resistivity of the products. Electricity consumption was calculated based on thepower consumption values provided in Table 1 of the PSR.Further assumptions for scenario development:The use phase of this study leverages the system boundary as described in Section 3.2 of the PSR, which details that Module B7 is not applicable and sothe module is equal to zero.End of Life (C1 - C4)C1 - C4 ModulesAssumptions for scenario development:The end-of-life scenario was modeled based on the assumptions provided in Appendix D within the PCR. Therefore, the study assumes 50% of all plasticmaterials (except polypropylene which is 40%) are sent to incineration, and all remaining plastic materials are sent to landfill. 30% of any aluminummaterials are sent to landfill, and the remaining aluminum is recycled. Furthermore, 40% of any copper materials are sent to landfill, and the remainingcopper materials are recycled. Finally, 1,000km is the distance assumed that all waste travel via truck before reaching its final disposal destination.Reuse, Recovery and / or Recycling Potentials & Relevant Scenario Information (D)D ModuleFurther assumptions for scenario development:For this study, energy recovery from plastic materials is calculated using the percentages of anyplastic (and any polypropylene) materials that were sent to incineration. Additionally, anyrecycled materials are modeled as a net benefit with recycling potential. The percentages forincineration and recycling are based on the values in Appendix D of the PCR.Category 6A Patch CordsPanduit CorporationPage 9 / 15
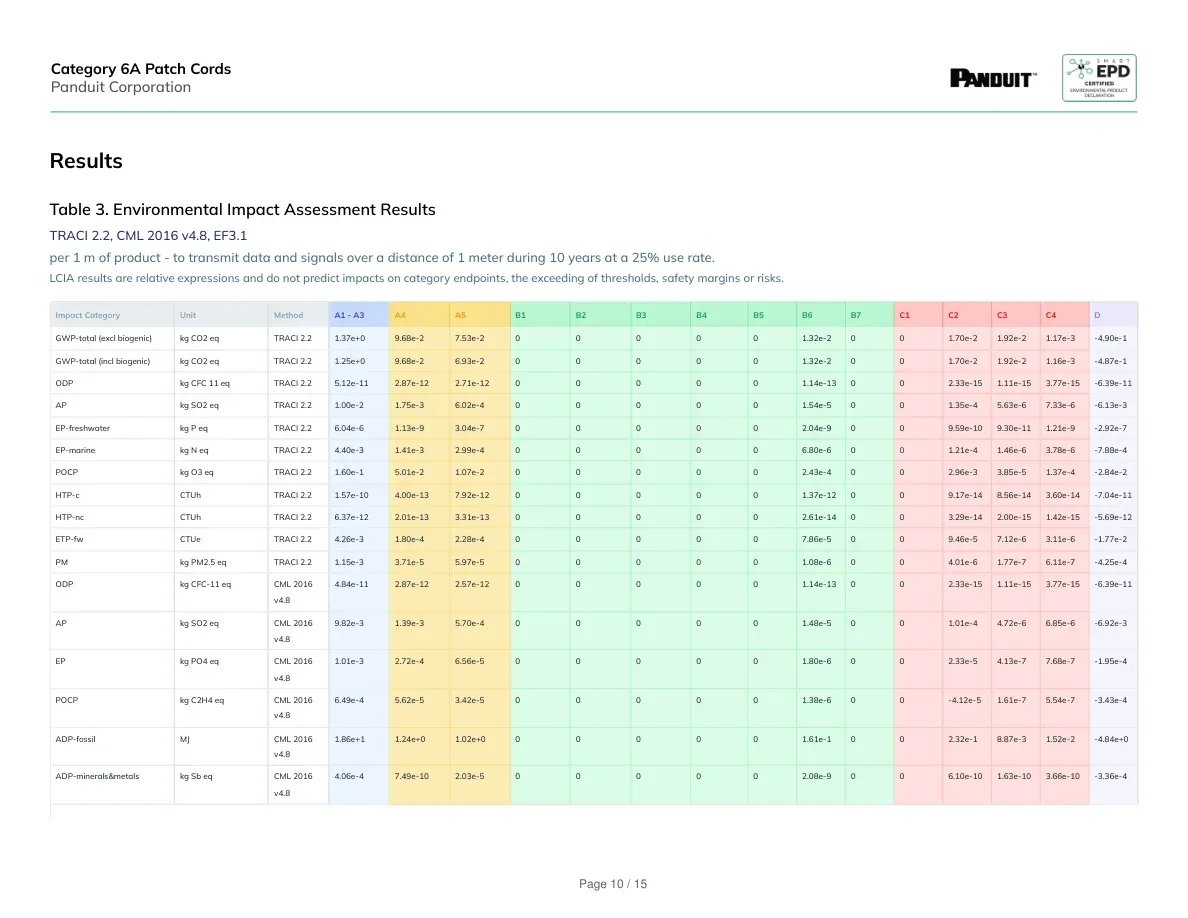
ResultsTable 3. Environmental Impact Assessment ResultsTRACI 2.2, CML 2016 v4.8, EF3.1per 1 m of product - to transmit data and signals over a distance of 1 meter during 10 years at a 25% use rate.LCIA results are relative expressions and do not predict impacts on category endpoints, the exceeding of thresholds, safety margins or risks.Impact CategoryUnitMethodA1 - A3A4A5B1B2B3B4B5B6B7C1C2C3C4DGWP-total (excl biogenic)kg CO2 eqTRACI 2.21.37e+09.68e-27.53e-2000001.32e-2001.70e-21.92e-21.17e-3-4.90e-1GWP-total (incl biogenic)kg CO2 eqTRACI 2.21.25e+09.68e-26.93e-2000001.32e-2001.70e-21.92e-21.16e-3-4.87e-1ODPkg CFC 11 eqTRACI 2.25.12e-112.87e-122.71e-12000001.14e-13002.33e-151.11e-153.77e-15-6.39e-11APkg SO2 eqTRACI 2.21.00e-21.75e-36.02e-4000001.54e-5001.35e-45.63e-67.33e-6-6.13e-3EP-freshwaterkg P eqTRACI 2.26.04e-61.13e-93.04e-7000002.04e-9009.59e-109.30e-111.21e-9-2.92e-7EP-marinekg N eqTRACI 2.24.40e-31.41e-32.99e-4000006.80e-6001.21e-41.46e-63.78e-6-7.88e-4POCPkg O3 eqTRACI 2.21.60e-15.01e-21.07e-2000002.43e-4002.96e-33.85e-51.37e-4-2.84e-2HTP-cCTUhTRACI 2.21.57e-104.00e-137.92e-12000001.37e-12009.17e-148.56e-143.60e-14-7.04e-11HTP-ncCTUhTRACI 2.26.37e-122.01e-133.31e-13000002.61e-14003.29e-142.00e-151.42e-15-5.69e-12ETP-fwCTUeTRACI 2.24.26e-31.80e-42.28e-4000007.86e-5009.46e-57.12e-63.11e-6-1.77e-2PMkg PM2.5 eqTRACI 2.21.15e-33.71e-55.97e-5000001.08e-6004.01e-61.77e-76.11e-7-4.25e-4ODPkg CFC-11 eqCML 2016v4.84.84e-112.87e-122.57e-12000001.14e-13002.33e-151.11e-153.77e-15-6.39e-11APkg SO2 eqCML 2016v4.89.82e-31.39e-35.70e-4000001.48e-5001.01e-44.72e-66.85e-6-6.92e-3EPkg PO4 eqCML 2016v4.81.01e-32.72e-46.56e-5000001.80e-6002.33e-54.13e-77.68e-7-1.95e-4POCPkg C2H4 eqCML 2016v4.86.49e-45.62e-53.42e-5000001.38e-600-4.12e-51.61e-75.54e-7-3.43e-4ADP-fossilMJCML 2016v4.81.86e+11.24e+01.02e+0000001.61e-1002.32e-18.87e-31.52e-2-4.84e+0ADP-minerals&metalskg Sb eqCML 2016v4.84.06e-47.49e-102.03e-5000002.08e-9006.10e-101.63e-103.66e-10-3.36e-4Category 6A Patch CordsPanduit CorporationPage 10 / 15
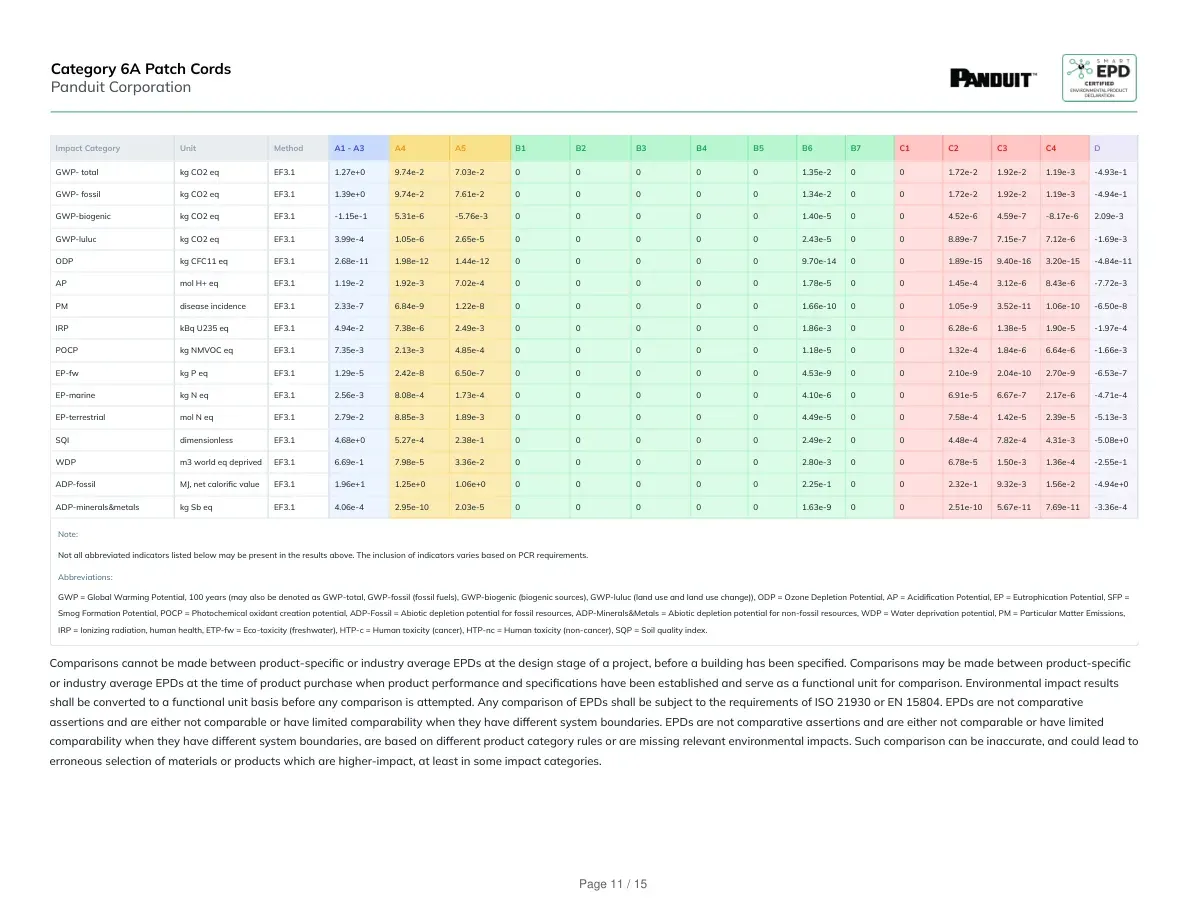
Impact CategoryUnitMethodA1 - A3A4A5B1B2B3B4B5B6B7C1C2C3C4DGWP- totalkg CO2 eqEF3.11.27e+09.74e-27.03e-2000001.35e-2001.72e-21.92e-21.19e-3-4.93e-1GWP- fossilkg CO2 eqEF3.11.39e+09.74e-27.61e-2000001.34e-2001.72e-21.92e-21.19e-3-4.94e-1GWP-biogenickg CO2 eqEF3.1-1.15e-15.31e-6-5.76e-3000001.40e-5004.52e-64.59e-7-8.17e-62.09e-3GWP-luluckg CO2 eqEF3.13.99e-41.05e-62.65e-5000002.43e-5008.89e-77.15e-77.12e-6-1.69e-3ODPkg CFC11 eqEF3.12.68e-111.98e-121.44e-12000009.70e-14001.89e-159.40e-163.20e-15-4.84e-11APmol H+ eqEF3.11.19e-21.92e-37.02e-4000001.78e-5001.45e-43.12e-68.43e-6-7.72e-3PMdisease incidenceEF3.12.33e-76.84e-91.22e-8000001.66e-10001.05e-93.52e-111.06e-10-6.50e-8IRPkBq U235 eqEF3.14.94e-27.38e-62.49e-3000001.86e-3006.28e-61.38e-51.90e-5-1.97e-4POCPkg NMVOC eqEF3.17.35e-32.13e-34.85e-4000001.18e-5001.32e-41.84e-66.64e-6-1.66e-3EP-fwkg P eqEF3.11.29e-52.42e-86.50e-7000004.53e-9002.10e-92.04e-102.70e-9-6.53e-7EP-marinekg N eqEF3.12.56e-38.08e-41.73e-4000004.10e-6006.91e-56.67e-72.17e-6-4.71e-4EP-terrestrialmol N eqEF3.12.79e-28.85e-31.89e-3000004.49e-5007.58e-41.42e-52.39e-5-5.13e-3SQIdimensionlessEF3.14.68e+05.27e-42.38e-1000002.49e-2004.48e-47.82e-44.31e-3-5.08e+0WDPm3 world eq deprivedEF3.16.69e-17.98e-53.36e-2000002.80e-3006.78e-51.50e-31.36e-4-2.55e-1ADP-fossilMJ, net calorific valueEF3.11.96e+11.25e+01.06e+0000002.25e-1002.32e-19.32e-31.56e-2-4.94e+0ADP-minerals&metalskg Sb eqEF3.14.06e-42.95e-102.03e-5000001.63e-9002.51e-105.67e-117.69e-11-3.36e-4Note:Not all abbreviated indicators listed below may be present in the results above. The inclusion of indicators varies based on PCR requirements.Abbreviations:GWP = Global Warming Potential, 100 years (may also be denoted as GWP-total, GWP-fossil (fossil fuels), GWP-biogenic (biogenic sources), GWP-luluc (land use and land use change)), ODP = Ozone Depletion Potential, AP = Acidification Potential, EP = Eutrophication Potential, SFP =Smog Formation Potential, POCP = Photochemical oxidant creation potential, ADP-Fossil = Abiotic depletion potential for fossil resources, ADP-Minerals&Metals = Abiotic depletion potential for non-fossil resources, WDP = Water deprivation potential, PM = Particular Matter Emissions,IRP = Ionizing radiation, human health, ETP-fw = Eco-toxicity (freshwater), HTP-c = Human toxicity (cancer), HTP-nc = Human toxicity (non-cancer), SQP = Soil quality index.Comparisons cannot be made between product-specific or industry average EPDs at the design stage of a project, before a building has been specified. Comparisons may be made between product-specificor industry average EPDs at the time of product purchase when product performance and specifications have been established and serve as a functional unit for comparison. Environmental impact resultsshall be converted to a functional unit basis before any comparison is attempted. Any comparison of EPDs shall be subject to the requirements of ISO 21930 or EN 15804. EPDs are not comparativeassertions and are either not comparable or have limited comparability when they have different system boundaries. EPDs are not comparative assertions and are either not comparable or have limitedcomparability when they have different system boundaries, are based on different product category rules or are missing relevant environmental impacts. Such comparison can be inaccurate, and could lead toerroneous selection of materials or products which are higher-impact, at least in some impact categories.Category 6A Patch CordsPanduit CorporationPage 11 / 15
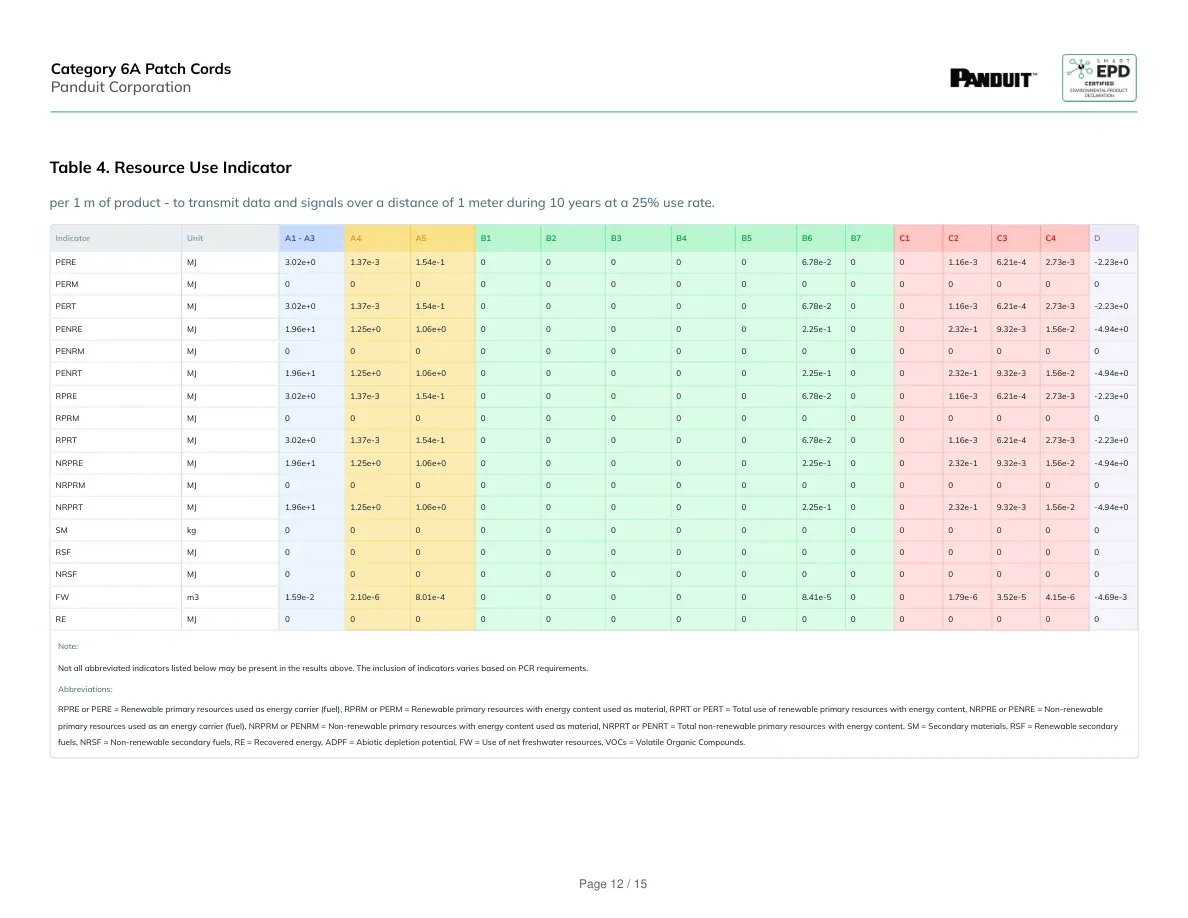
Table 4. Resource Use Indicatorper 1 m of product - to transmit data and signals over a distance of 1 meter during 10 years at a 25% use rate.IndicatorUnitA1 - A3A4A5B1B2B3B4B5B6B7C1C2C3C4DPEREMJ3.02e+01.37e-31.54e-1000006.78e-2001.16e-36.21e-42.73e-3-2.23e+0PERMMJ000000000000000PERTMJ3.02e+01.37e-31.54e-1000006.78e-2001.16e-36.21e-42.73e-3-2.23e+0PENREMJ1.96e+11.25e+01.06e+0000002.25e-1002.32e-19.32e-31.56e-2-4.94e+0PENRMMJ000000000000000PENRTMJ1.96e+11.25e+01.06e+0000002.25e-1002.32e-19.32e-31.56e-2-4.94e+0RPREMJ3.02e+01.37e-31.54e-1000006.78e-2001.16e-36.21e-42.73e-3-2.23e+0RPRMMJ000000000000000RPRTMJ3.02e+01.37e-31.54e-1000006.78e-2001.16e-36.21e-42.73e-3-2.23e+0NRPREMJ1.96e+11.25e+01.06e+0000002.25e-1002.32e-19.32e-31.56e-2-4.94e+0NRPRMMJ000000000000000NRPRTMJ1.96e+11.25e+01.06e+0000002.25e-1002.32e-19.32e-31.56e-2-4.94e+0SMkg000000000000000RSFMJ000000000000000NRSFMJ000000000000000FWm31.59e-22.10e-68.01e-4000008.41e-5001.79e-63.52e-54.15e-6-4.69e-3REMJ000000000000000Note:Not all abbreviated indicators listed below may be present in the results above. The inclusion of indicators varies based on PCR requirements.Abbreviations:RPRE or PERE = Renewable primary resources used as energy carrier (fuel), RPRM or PERM = Renewable primary resources with energy content used as material, RPRT or PERT = Total use of renewable primary resources with energy content, NRPRE or PENRE = Non-renewableprimary resources used as an energy carrier (fuel), NRPRM or PENRM = Non-renewable primary resources with energy content used as material, NRPRT or PENRT = Total non-renewable primary resources with energy content, SM = Secondary materials, RSF = Renewable secondaryfuels, NRSF = Non-renewable secondary fuels, RE = Recovered energy, ADPF = Abiotic depletion potential, FW = Use of net freshwater resources, VOCs = Volatile Organic Compounds.Category 6A Patch CordsPanduit CorporationPage 12 / 15
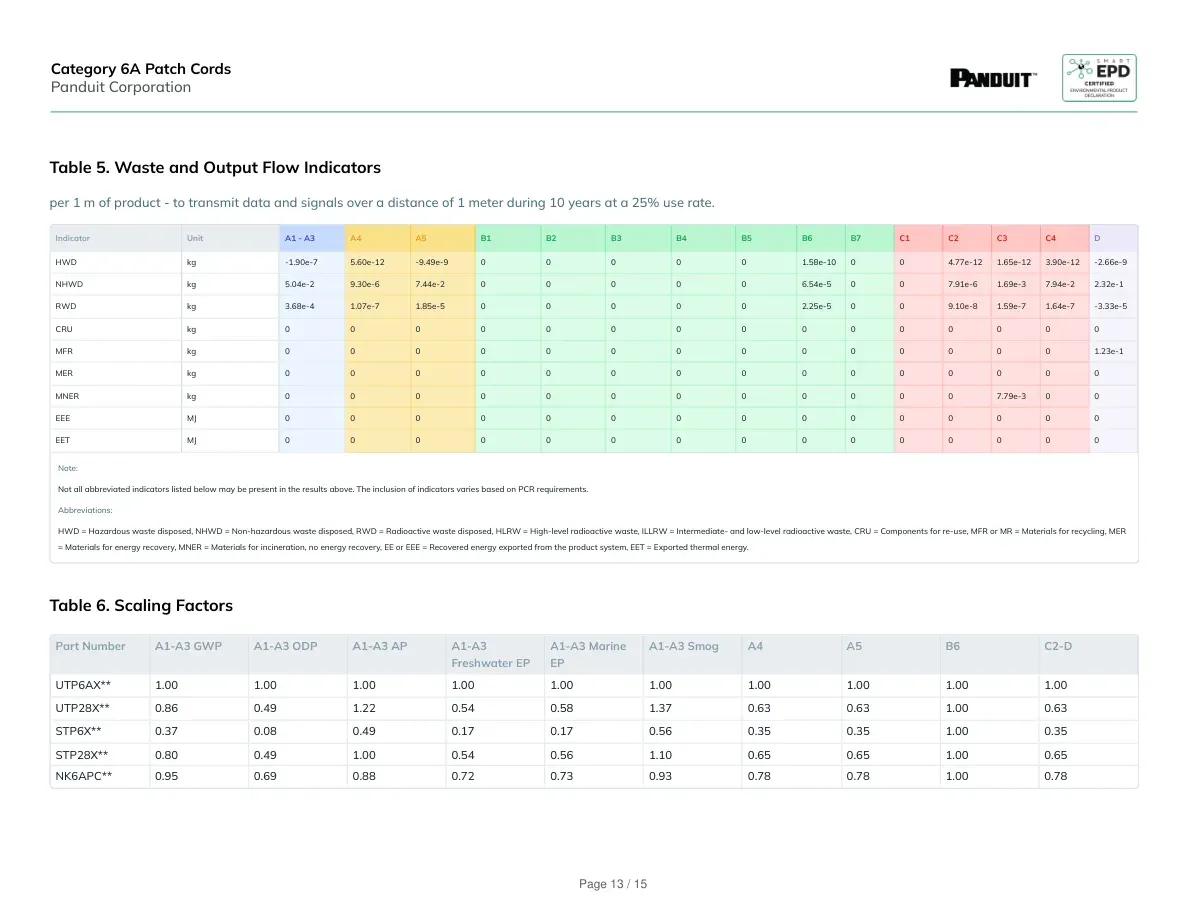
Table 5. Waste and Output Flow Indicatorsper 1 m of product - to transmit data and signals over a distance of 1 meter during 10 years at a 25% use rate.IndicatorUnitA1 - A3A4A5B1B2B3B4B5B6B7C1C2C3C4DHWDkg-1.90e-75.60e-12-9.49e-9000001.58e-10004.77e-121.65e-123.90e-12-2.66e-9NHWDkg5.04e-29.30e-67.44e-2000006.54e-5007.91e-61.69e-37.94e-22.32e-1RWDkg3.68e-41.07e-71.85e-5000002.25e-5009.10e-81.59e-71.64e-7-3.33e-5CRUkg000000000000000MFRkg000000000000001.23e-1MERkg000000000000000MNERkg0000000000007.79e-300EEEMJ000000000000000EETMJ000000000000000Note:Not all abbreviated indicators listed below may be present in the results above. The inclusion of indicators varies based on PCR requirements.Abbreviations:HWD = Hazardous waste disposed, NHWD = Non-hazardous waste disposed, RWD = Radioactive waste disposed, HLRW = High-level radioactive waste, ILLRW = Intermediate- and low-level radioactive waste, CRU = Components for re-use, MFR or MR = Materials for recycling, MER= Materials for energy recovery, MNER = Materials for incineration, no energy recovery, EE or EEE = Recovered energy exported from the product system, EET = Exported thermal energy.Table 6. Scaling FactorsPart NumberA1-A3 GWPA1-A3 ODPA1-A3 APA1-A3Freshwater EPA1-A3 MarineEPA1-A3 SmogA4A5B6C2-DUTP6AX**1.001.001.001.001.001.001.001.001.001.00UTP28X**0.860.491.220.540.581.370.630.631.000.63STP6X**0.370.080.490.170.170.560.350.351.000.35STP28X**0.800.491.000.540.561.100.650.651.000.65NK6APC**0.950.690.880.720.730.930.780.781.000.78Category 6A Patch CordsPanduit CorporationPage 13 / 15
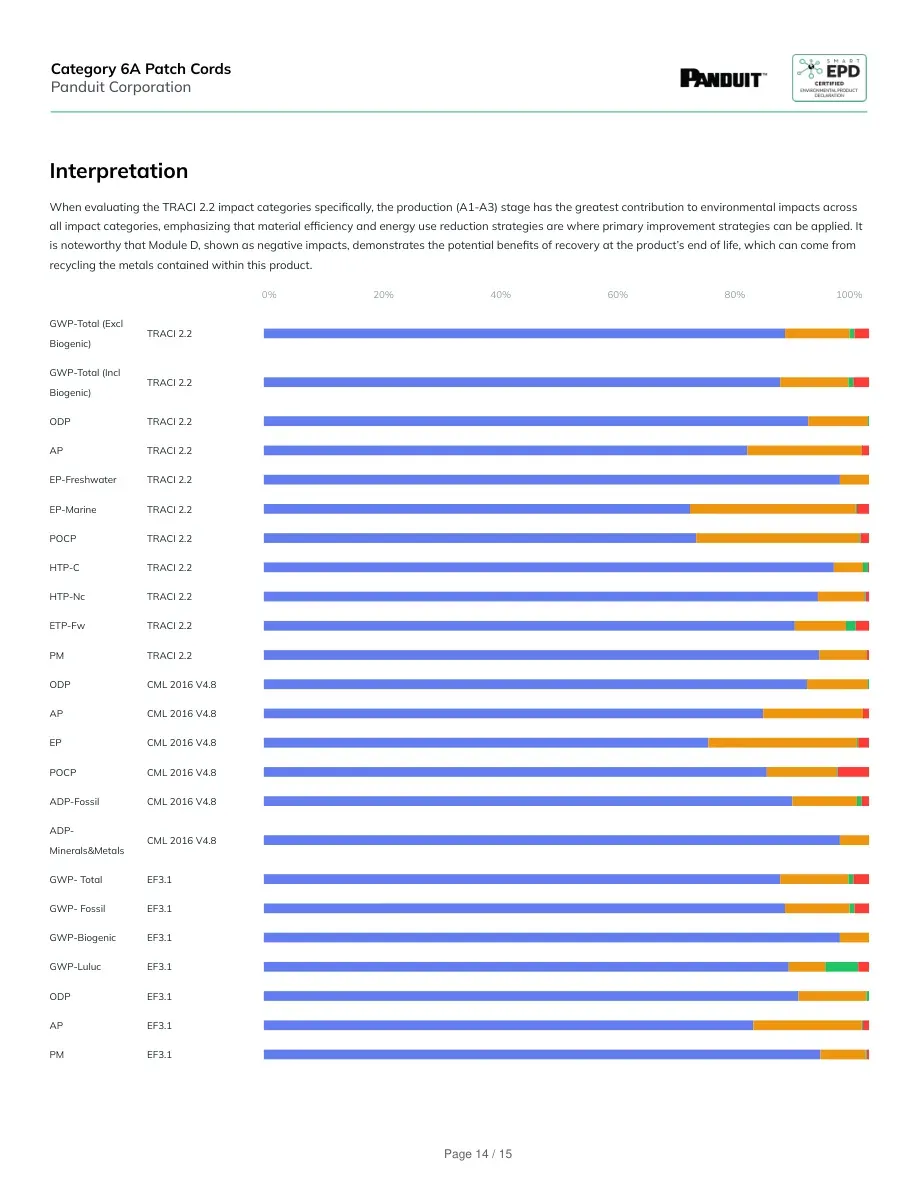
InterpretationWhen evaluating the TRACI 2.2 impact categories specifically, the production (A1-A3) stage has the greatest contribution to environmental impacts acrossall impact categories, emphasizing that material efficiency and energy use reduction strategies are where primary improvement strategies can be applied. Itis noteworthy that Module D, shown as negative impacts, demonstrates the potential benefits of recovery at the product’s end of life, which can come fromrecycling the metals contained within this product.0%20%40%60%80%100%GWP-Total (ExclBiogenic)TRACI 2.2GWP-Total (InclBiogenic)TRACI 2.2ODPTRACI 2.2APTRACI 2.2EP-FreshwaterTRACI 2.2EP-MarineTRACI 2.2POCPTRACI 2.2HTP-CTRACI 2.2HTP-NcTRACI 2.2ETP-FwTRACI 2.2PMTRACI 2.2ODPCML 2016 V4.8APCML 2016 V4.8EPCML 2016 V4.8POCPCML 2016 V4.8ADP-FossilCML 2016 V4.8ADP-Minerals&MetalsCML 2016 V4.8GWP- TotalEF3.1GWP- FossilEF3.1GWP-BiogenicEF3.1GWP-LulucEF3.1ODPEF3.1APEF3.1PMEF3.1Category 6A Patch CordsPanduit CorporationPage 14 / 15
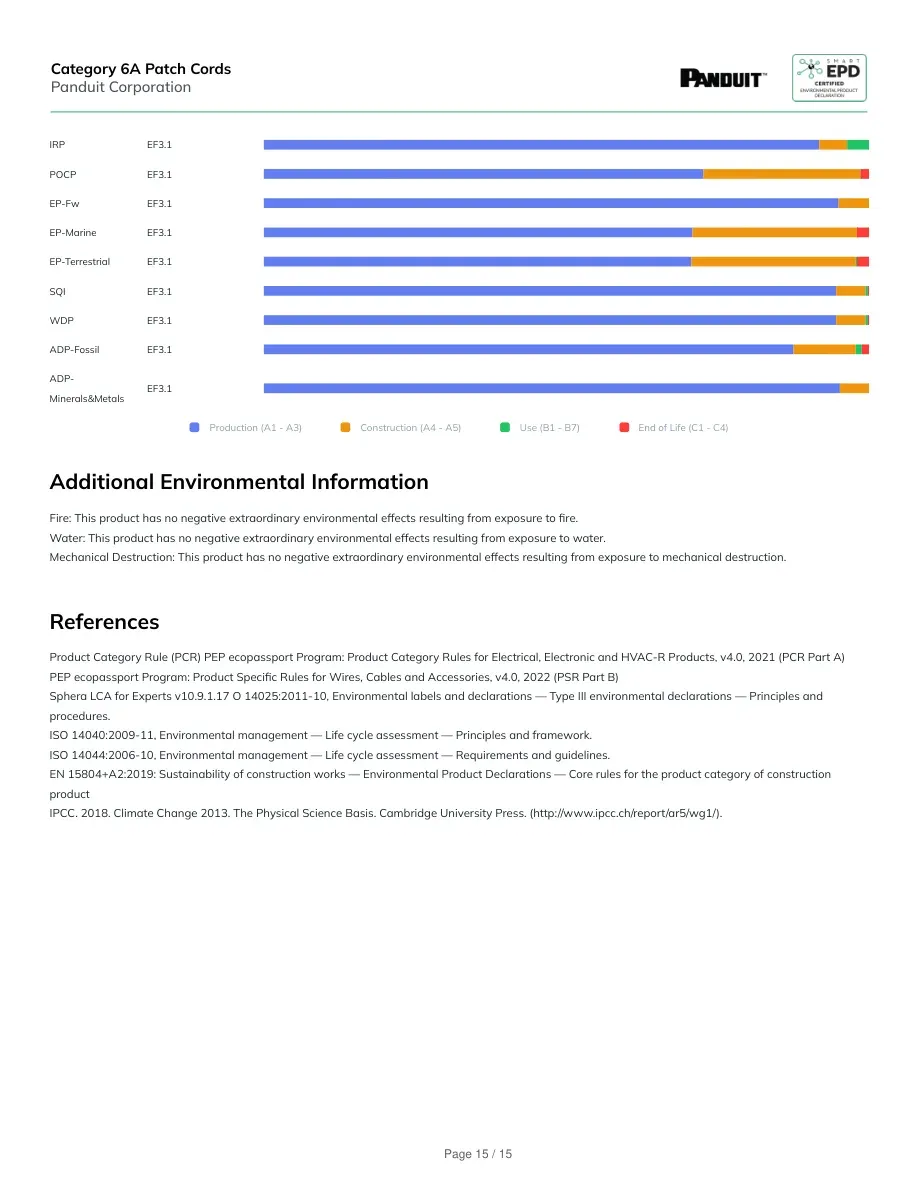
IRPEF3.1POCPEF3.1EP-FwEF3.1EP-MarineEF3.1EP-TerrestrialEF3.1SQIEF3.1WDPEF3.1ADP-FossilEF3.1ADP-Minerals&MetalsEF3.1Production (A1 - A3)Construction (A4 - A5)Use (B1 - B7)End of Life (C1 - C4)Additional Environmental InformationFire: This product has no negative extraordinary environmental effects resulting from exposure to fire.Water: This product has no negative extraordinary environmental effects resulting from exposure to water.Mechanical Destruction: This product has no negative extraordinary environmental effects resulting from exposure to mechanical destruction.ReferencesProduct Category Rule (PCR) PEP ecopassport Program: Product Category Rules for Electrical, Electronic and HVAC-R Products, v4.0, 2021 (PCR Part A)PEP ecopassport Program: Product Specific Rules for Wires, Cables and Accessories, v4.0, 2022 (PSR Part B)Sphera LCA for Experts v10.9.1.17 O 14025:2011-10, Environmental labels and declarations — Type III environmental declarations — Principles andprocedures.ISO 14040:2009-11, Environmental management — Life cycle assessment — Principles and framework.ISO 14044:2006-10, Environmental management — Life cycle assessment — Requirements and guidelines.EN 15804+A2:2019: Sustainability of construction works — Environmental Product Declarations — Core rules for the product category of constructionproductIPCC. 2018. Climate Change 2013. The Physical Science Basis. Cambridge University Press. (http://www.ipcc.ch/report/ar5/wg1/).Category 6A Patch CordsPanduit CorporationPage 15 / 15